We can build it and make things better.
I'm open to new projects and other opportunities.
Let's Connect →

ENTERPRISE RISK ANALYTICS
Sumitomo Spyglass is data-driven AI tool that analyzes, monitors and predicts actions across global business vectors of impact.
Spyglass is designed for Sumitomo’s advanced materials division. It enables predictive monitoring of production data and real-time detection of material stress and inefficiencies.
Capabilities for managing logistics, inventory and supply chain management were confined to an antiquated database with manual processes. Executives needed an optimal way to analyze data, monitor investments, and identify business opportunities to manage the companies they oversee.
Spyglass is a centralized business intelligence platform that ingests contextual real-time data based on user preferences. It leverages predictive data modeling to provide a financial data summary, facilitate supply chain root cause analytics, and present cost-saving and revenue-generating recommendations.
Senior UX Designer, Hypergiant
12 Weeks
Data Engineer, Data Scientist, Developer, Senior Designer, Ul Designer
Figma, Confluence, Jira, Slack
Mapped how analysts moved across 4 disconnected systems to trace entity relationships, and found the real bottleneck wasn't data entry. It was losing context every time they switched tools.
Broke down what actually feeds the Failure Prediction Model (financial and non-financial indicators, company valuation) and established that every score needed to show its reasoning, not just a number.
Designed both a node-graph and a table view for relationship mapping since node-graph won for pattern-spotting and table won for reporting. Built conversational pattern for alert setup so user stayed in their task flow.
Validated alert detection through anomaly investigation via event-based wireframe flows against the actual sequence of questions a user asks when something gets flagged, refining through stakeholder review cycles.
Delivered a prototype supporting cross-entity investigations, with score transparency and relationship visibility built in as core requirements, not later additions.
PRODUCT EXPERIENCE
A unified workspace that helps business leaders navigate and analyze complexity, connect the dots, and make informed decisions.

SYSTEM OVERVIEW
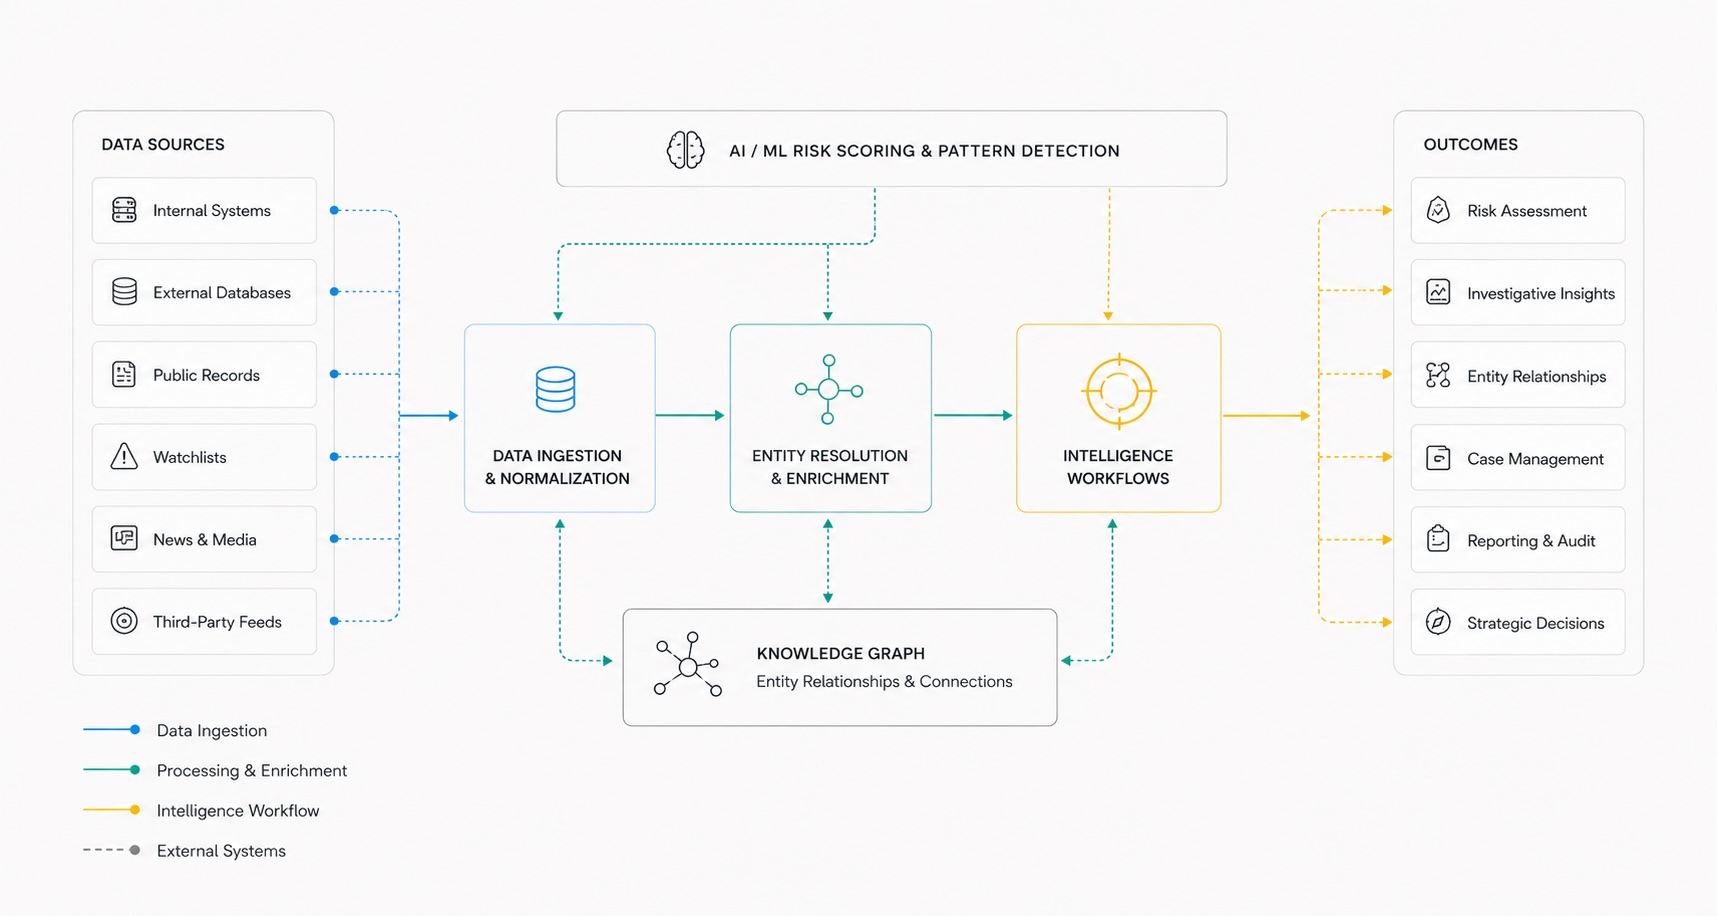
Sumitomo Spyglass connects disparate data sources and operational systems into a unified intelligence platform, enabling business leaders that ability to uncover data correlations, assess risk, and accelerate investigations.
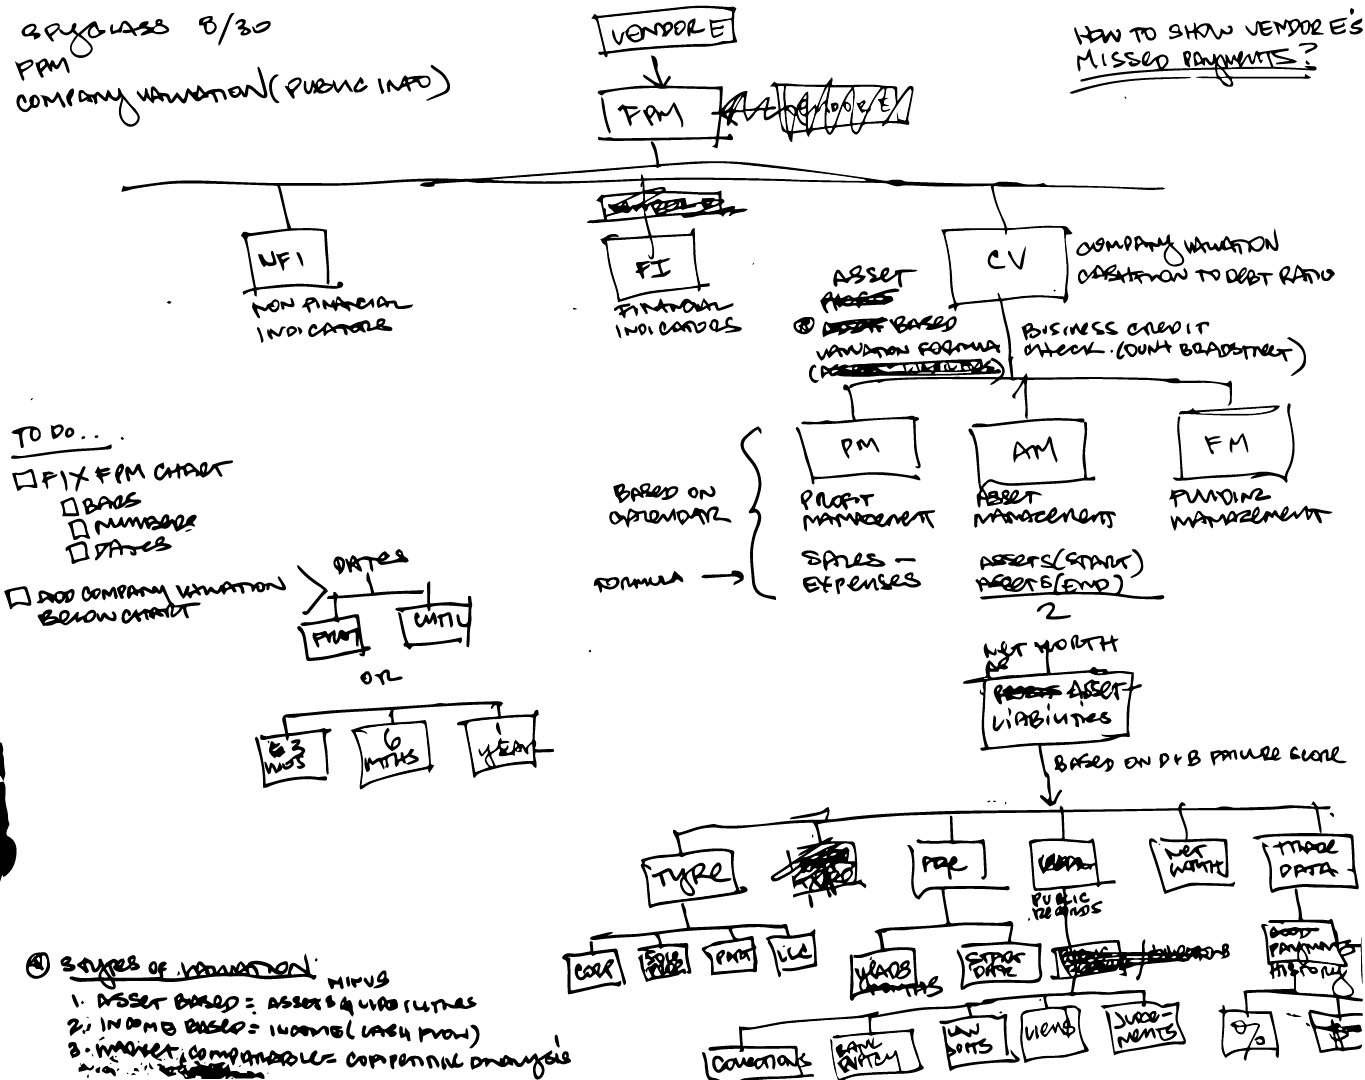
I broke down what actually feeds Spyglass's Failure Prediction Model which are categories of financial vs. non-financial indicator groups, then company valuation split into profit, asset, and funding management. Each branch was tied back to real public data sources. This structure became the foundation for the AI Data Schema Architecture that followed.
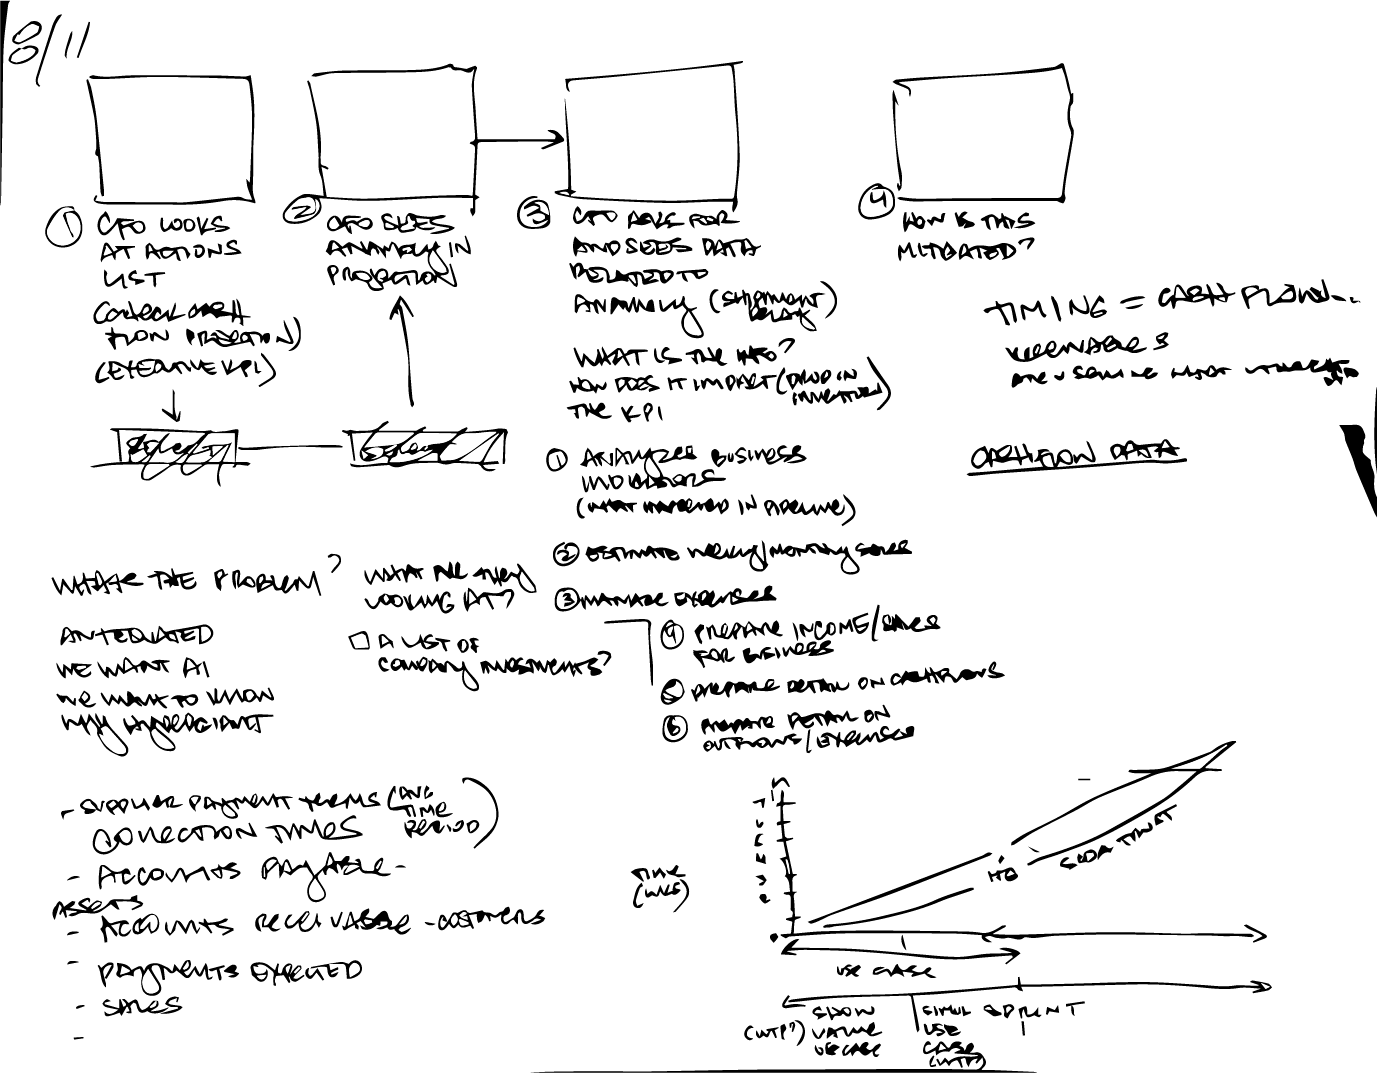
I traced the sequence of questions a CFO actually asks when Spyglass flags an anomaly, what changes, why it changes, and how it should be mitigated. Working through what data needed to surface at each step (i.e. supplier payment terms, accounts receivable/payable, sales) became the backbone for the event-based wireframe flows shown later in this case study.
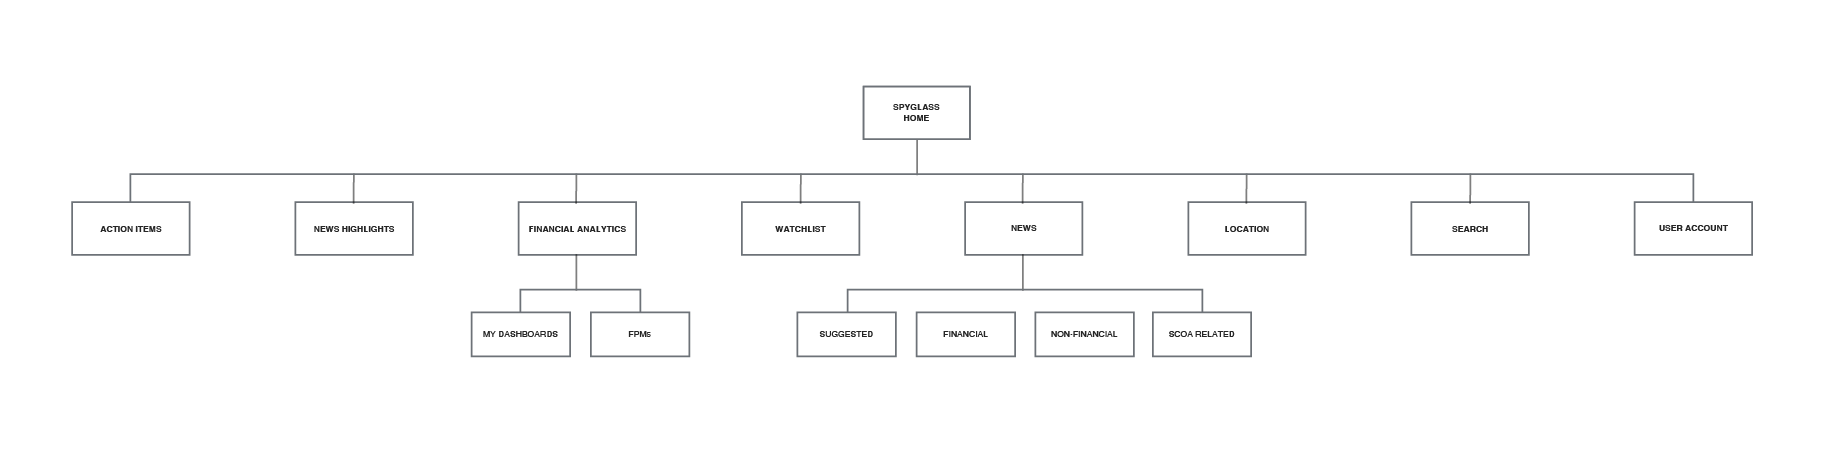
The IA is organized around how a CFO actually works day-to-day. Action Items and News Highlights surface what needs attention first, branching into Financial Analytics (dashboards and Failure Prediction Models), a Watchlist for flagged entities, and categorized News. Keeping Action Items and Watchlist as top-level was deliberate, as they are entry points for a time-constrained CFO.
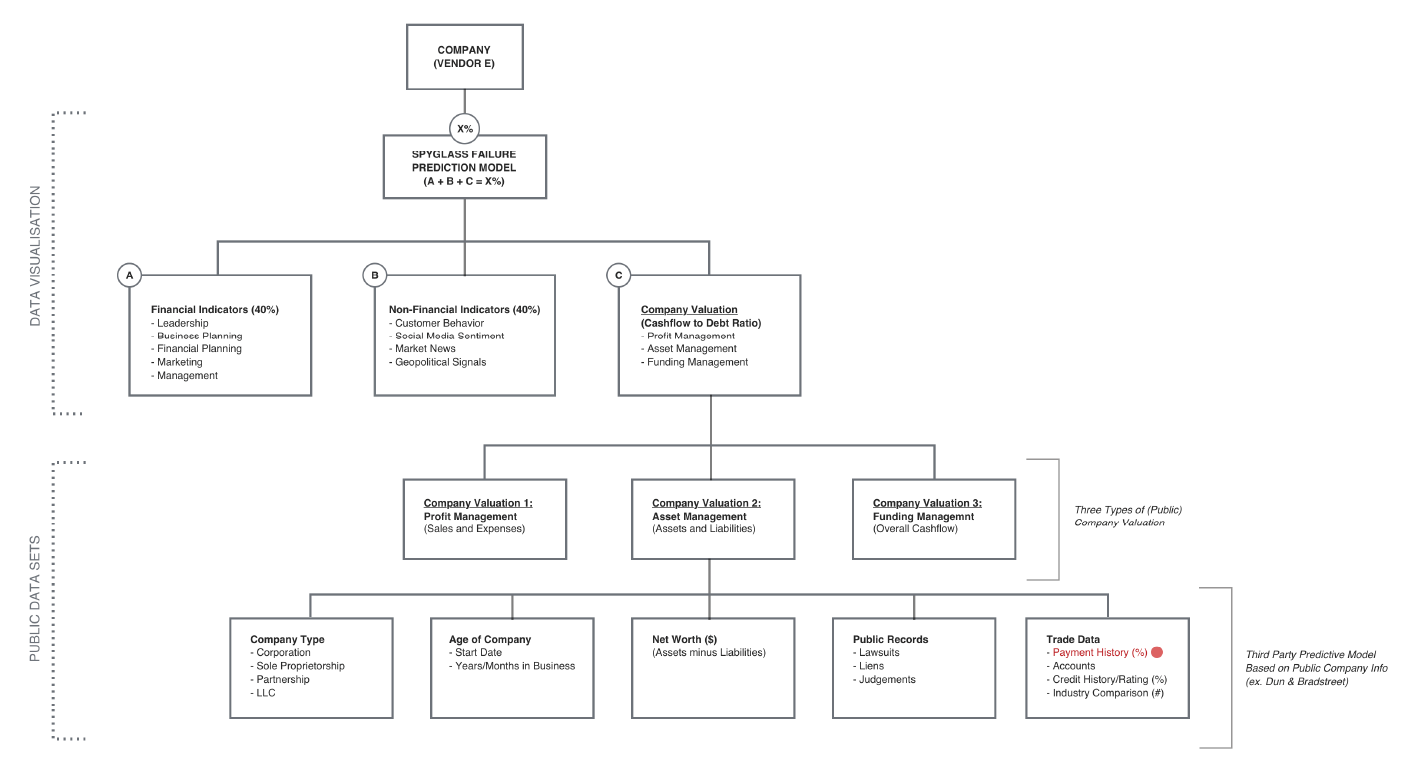
This schema documents how Spyglass calculates its Failure Prediction Model score: Financial and Non-Financial Indicators each weighted 40%, Company Valuation weighted 20%, combining into a single percentage per vendor. Every branch traces back to a real public data source including company type, age, net worth, public records, and trade data like payment history, sourced from third-party providers. Documenting this early ensured the UI could show why a score changed, not just the score itself. This requirement that came directly out of discovery once it was clear CFOs didn't trust an unexplained percentage.
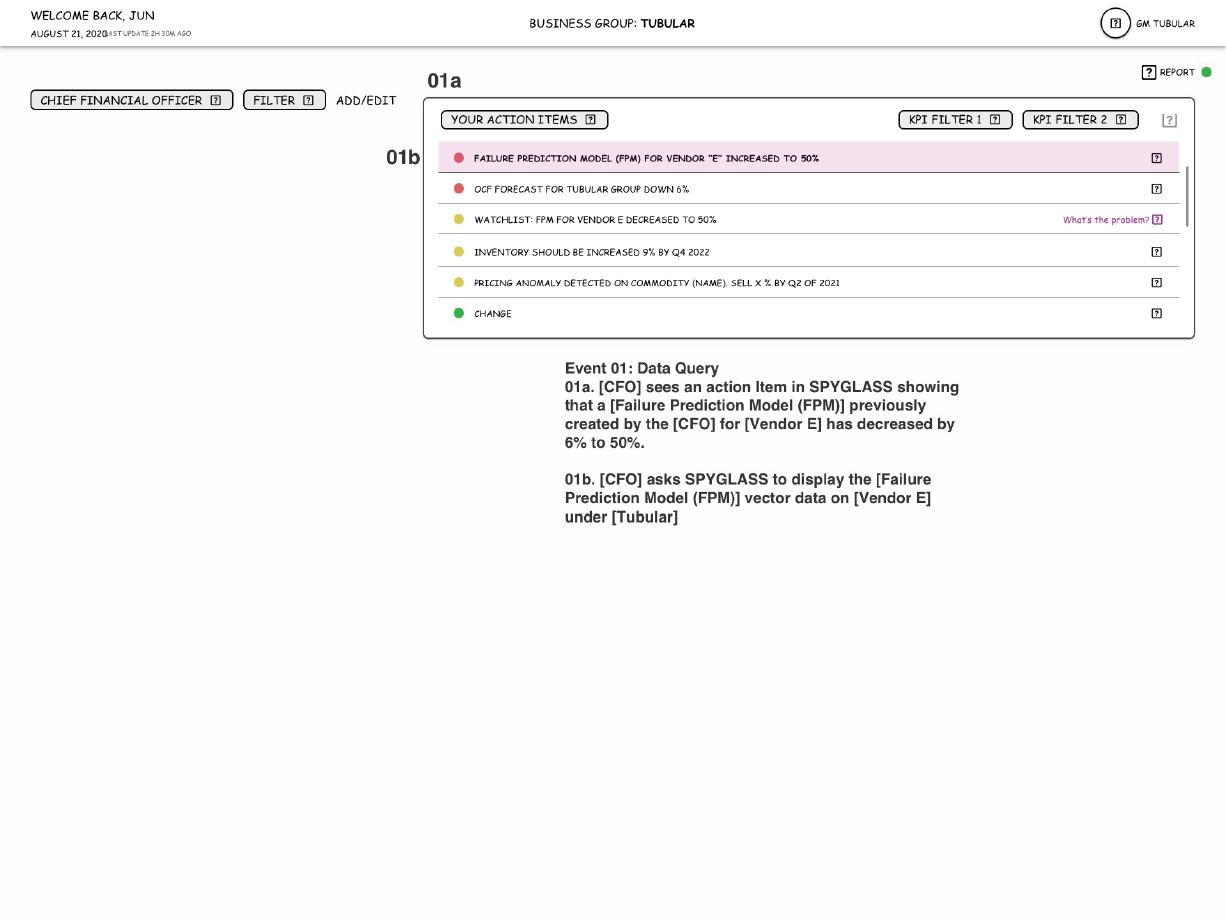
The CFO's dashboard spots an issue. Action items are ranked by severity, like Vendor E's Failure Prediction Model jumping to 50%. It traces the first event, the CFO notices a flagged change and asks Spyglass to display the underlying data behind it.
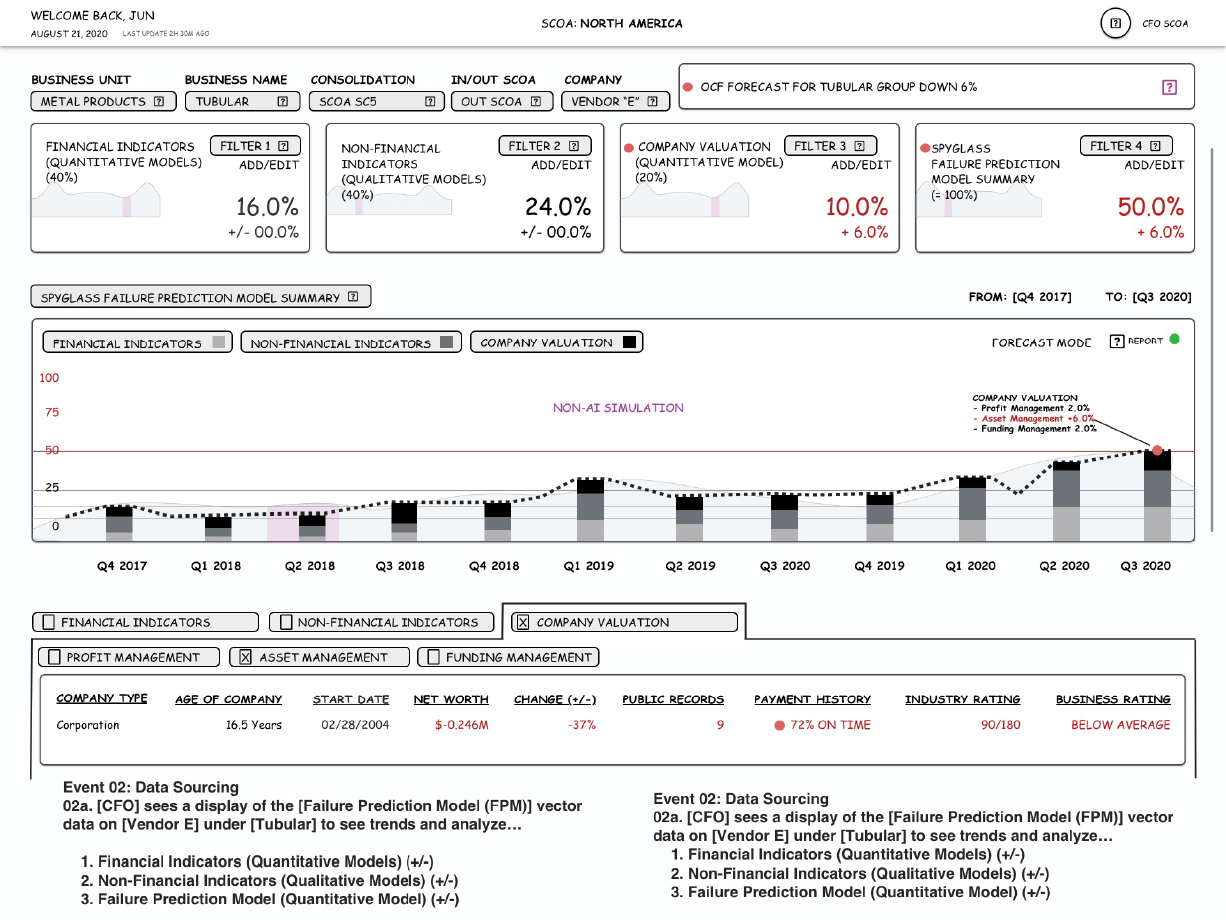
The CFO drills into the requested data and sees a summary breaking the score into its Financial, Non-Financial, and Company Valuation components, plotted over a multi-year trend. The table below surfaces the specific data points driving the score, so the CFO sees the reasoning, not just the number.
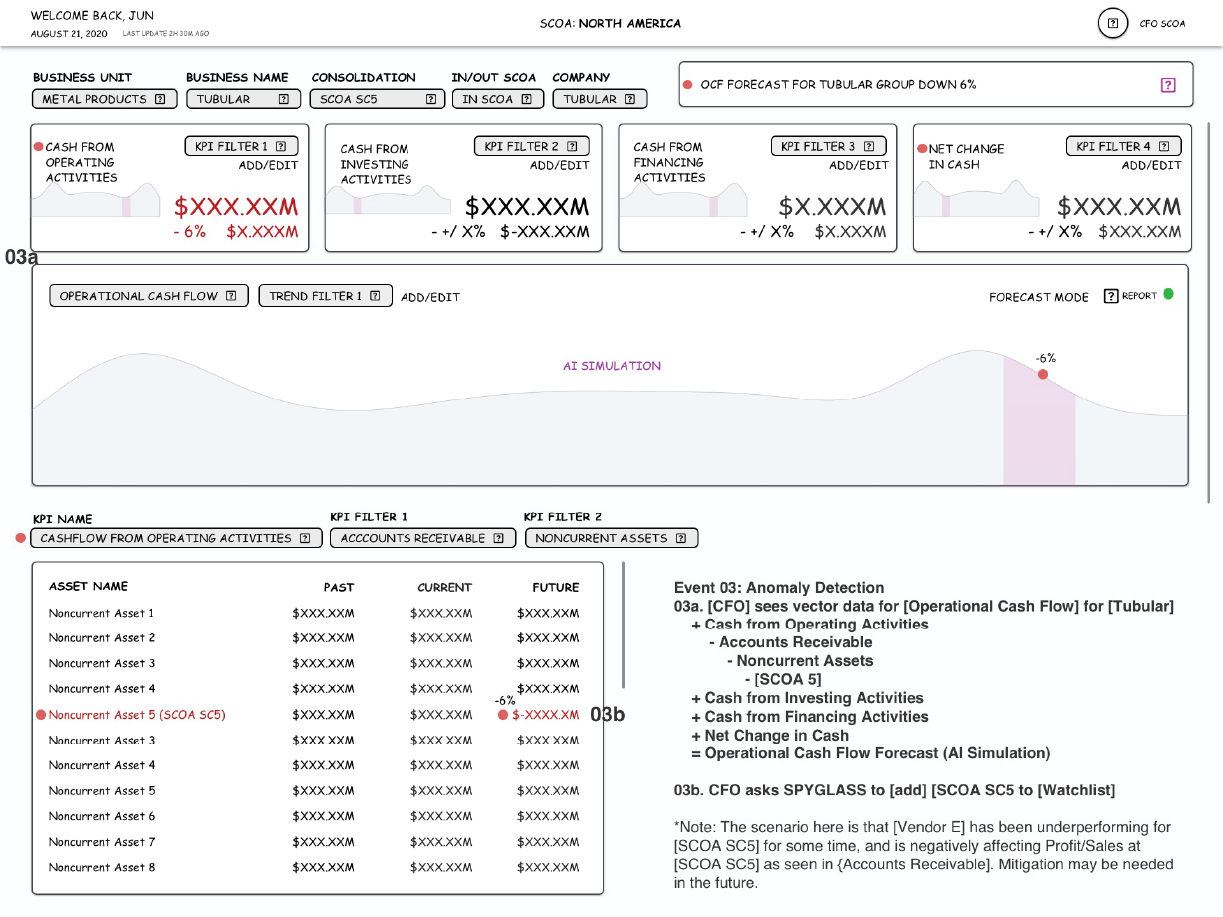
The CFO investigates the cash flow anomaly behind a forecast drop. The asset table breaks down past, current, and forecasted values, flagging the specific asset driving the change, and lets the CFO add it directly to their Watchlist.
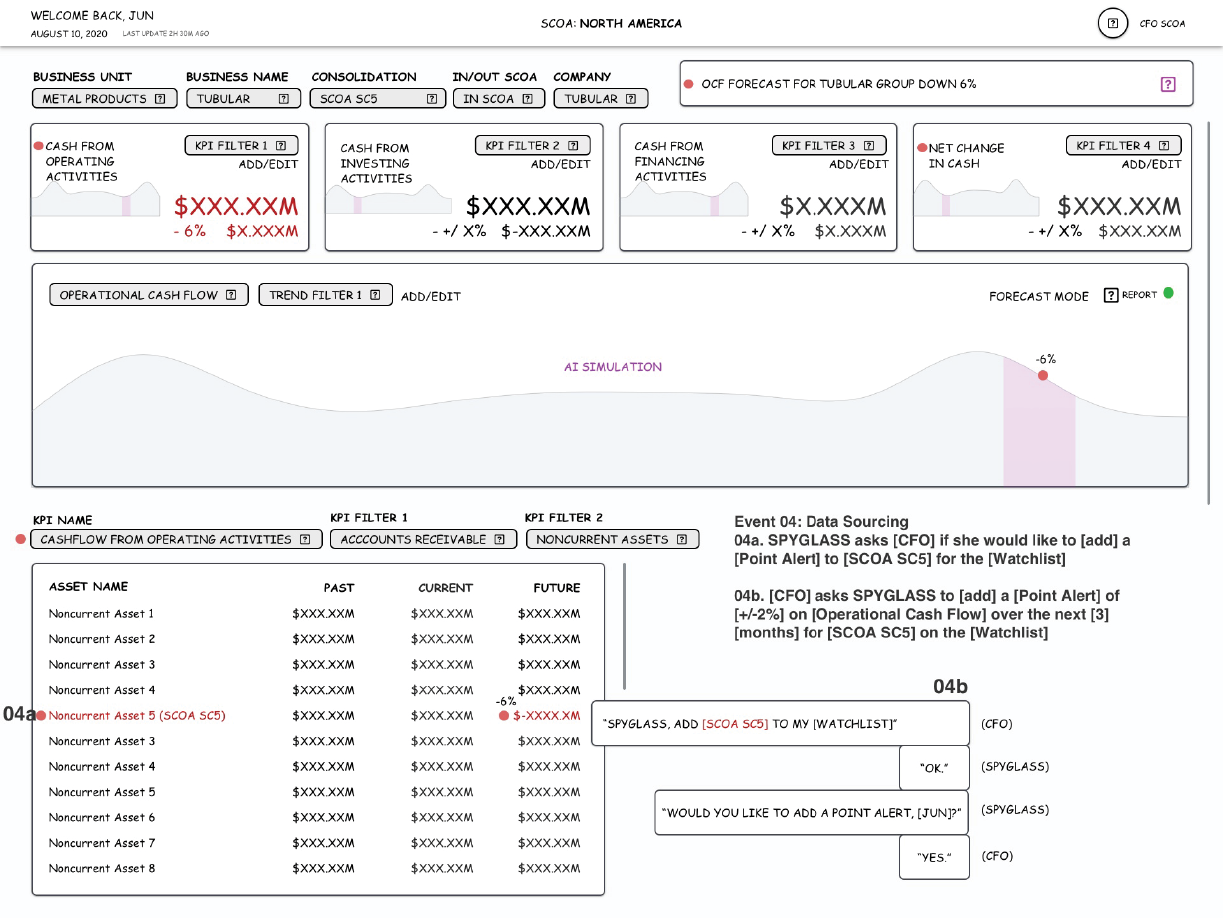
Spyglass proactively offers to set up monitoring after the CFO adds an entity to their Watchlist, using a conversational pattern which keeps the CFO in their existing task flow instead of routing them to a separate configuration screen.
QUALITATIVE IMPACT & OUTCOMES
Spyglass empowers business leaders to work smarter, reduce or eliminate manual effort, and make better decisions.

Reduced the user's path from noticing a flagged anomaly to understanding its cause, replacing manual cross-referencing via four systems with a single flow.

Every Failure Prediction Model score now shows its underlying data trail, addressing the trust gap that made CFOs skeptical of an unexplained percentage.

Relationship mapping replaced fragmented lookups, giving analysts both pattern-level and report-level views of the same data.
Iterative stakeholder reviews accelerated validation of investigation workflows before handoff.