We can build it and make things better.
I'm open to new projects and other opportunities.
Let's Connect →

PREDICTIVE DATA ANALYTICS
SBI Watchtower is a signals-driven application that correlates and analyzes public financial, market and investment data.
SBI Watchtower was designed as a predictive analytics platform focused on identifying operational risk, financial anomalies, and market intelligence patterns across enterprise and industrial environments. The platform centralized data modeling, forecasting workflows, and operational intelligence into a unified decision-support system.
Critical operational and financial data existed across fragmented systems, limiting visibility into predictive trends, risk indicators, and performance forecasting. Analysts and stakeholders lacked centralized tools for monitoring operational anomalies, evaluating risk exposure, and interpreting large-scale predictive data relationships.
SBI Watchtower is a data management tool that collects, correlates, and relays information that enables users to make data-driven purchase decisions to maximize profitability and market share for their steel products. It replaces outdated reactive triaging driven by revenue targets, and proactively surfaces production analytics, investment opportunities, and alerts users of risks.
Senior UX Designer, Hypergiant
16 Weeks
Data Engineer, Data Scientist, Developer, Senior Designer, Ul Designer
Figma, Confluence, Jira, Slack
Mapped the analyst's path from noticing a market signal to acting on it, and found repeated re-verification of data trustworthiness at multiple steps along the way.
Built an IA organized by data source and signal type rather than by feature, so users can cross-reference operational and financial data without leaving working context.
Designed signal cards that always surface why something was flagged alongside the prediction itself, rather than presenting a confidence score as a black box.
Validated the data source integrations against user workflows, testing whether a consistent template across sources verus whether each needed its own treatment.
Delivered a functional prototype supporting cross-entity investigations and forecasting, with data provenance built into the core interaction model.
SYSTEM OVERVIEW
SBI Watchtower unifies operational forecasting, anomaly detection, and predictive intelligence workflows into a centralized enterprise analytics platform designed for scalable decision support and risk evaluation.
The application is can also generate predictive intelligence reports, forecasting summaries, and operational analytics documentation for stakeholders.

PRODUCT EXPERIENCE
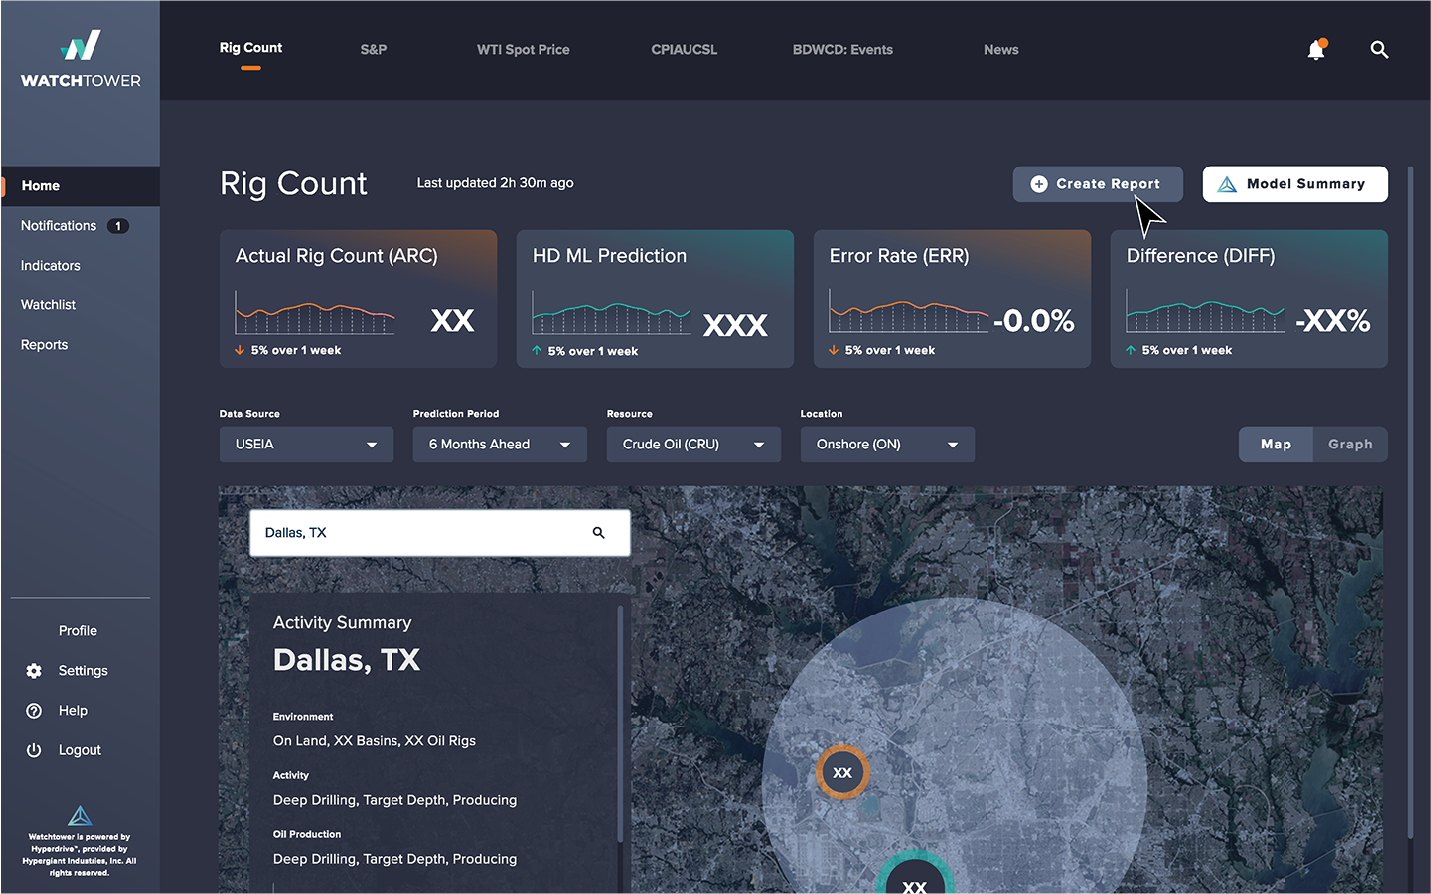
The Rig Count home view surfaces the four core metrics analysts track, Actual Rig Count, HD ML Prediction, Error Rate, and Difference, with week-over-week trend lines so a shift is visible at a glance. Filtering by data source, prediction period, resource, and location lets users narrow down from a national trend to activity in a specific location, like drilling depth and production status for a single city.
PRODUCT EXPERIENCE
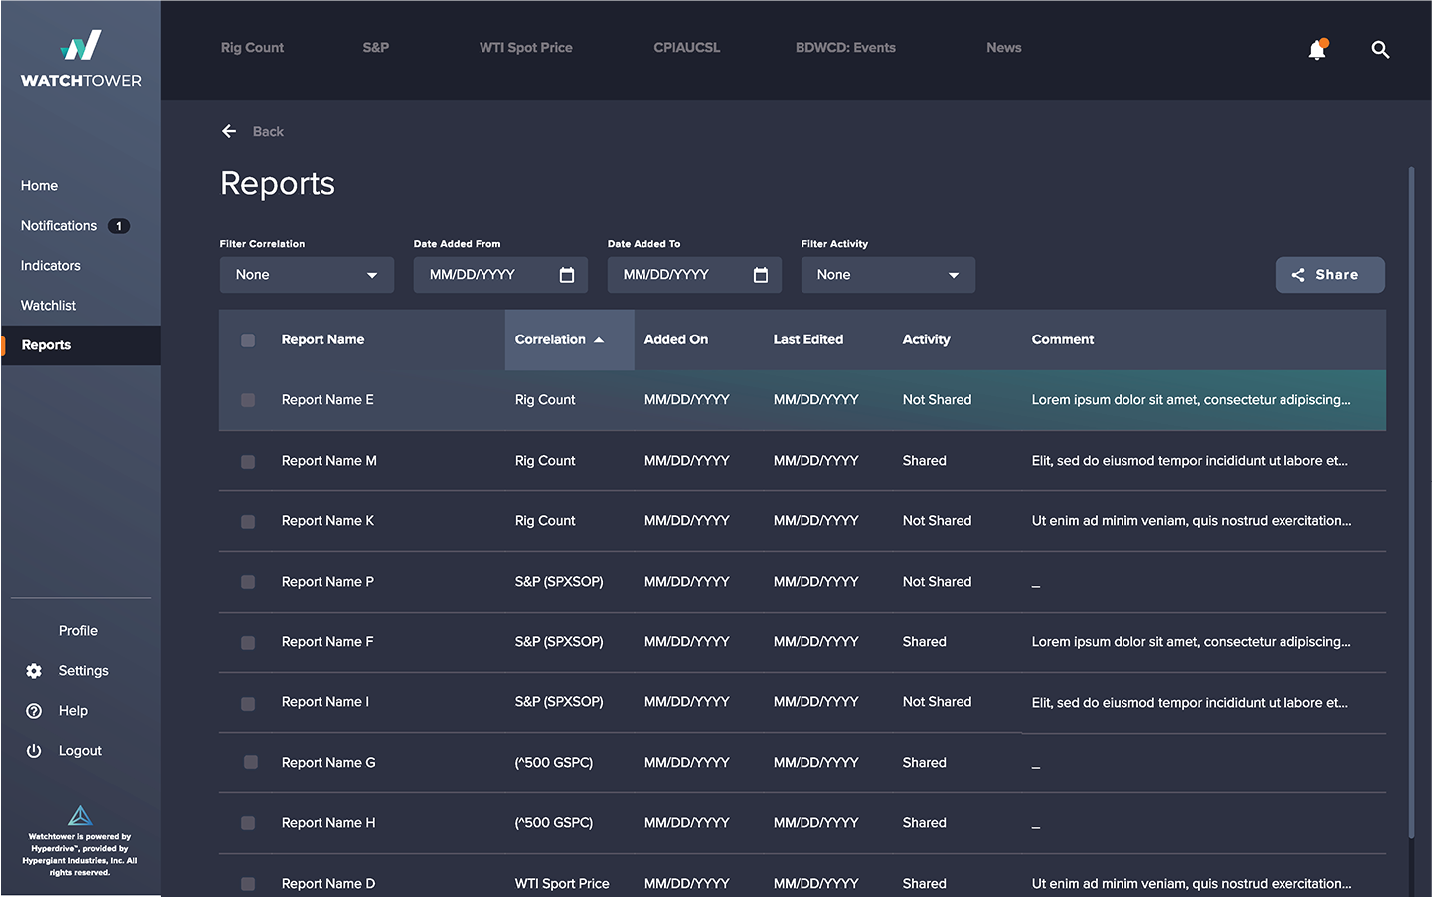
The Reports view lets analysts manage and filter every report they've generated by correlation type (Rig Count, S&P, WTI Spot Price), date range, and sharing status. Surfacing "Shared" vs. "Not Shared" directly in the table, rather than requiring a click into each report. This helps users quickly see which findings have already been distributed to stakeholders versus which still need review.
PRODUCT EXPERIENCE
Opening an individual report surfaces the full prediction model behind it including correlation source, actual vs. predicted values, error rate, and the underlying model's performance metrics, alongside a comment thread and sharing status.
Keeping model provenance (i.e. who generated it, when, and what indicator it's measuring) visible alongside the data itself was intentional, so a shared report never loses its context once it's shared with stakeholders.

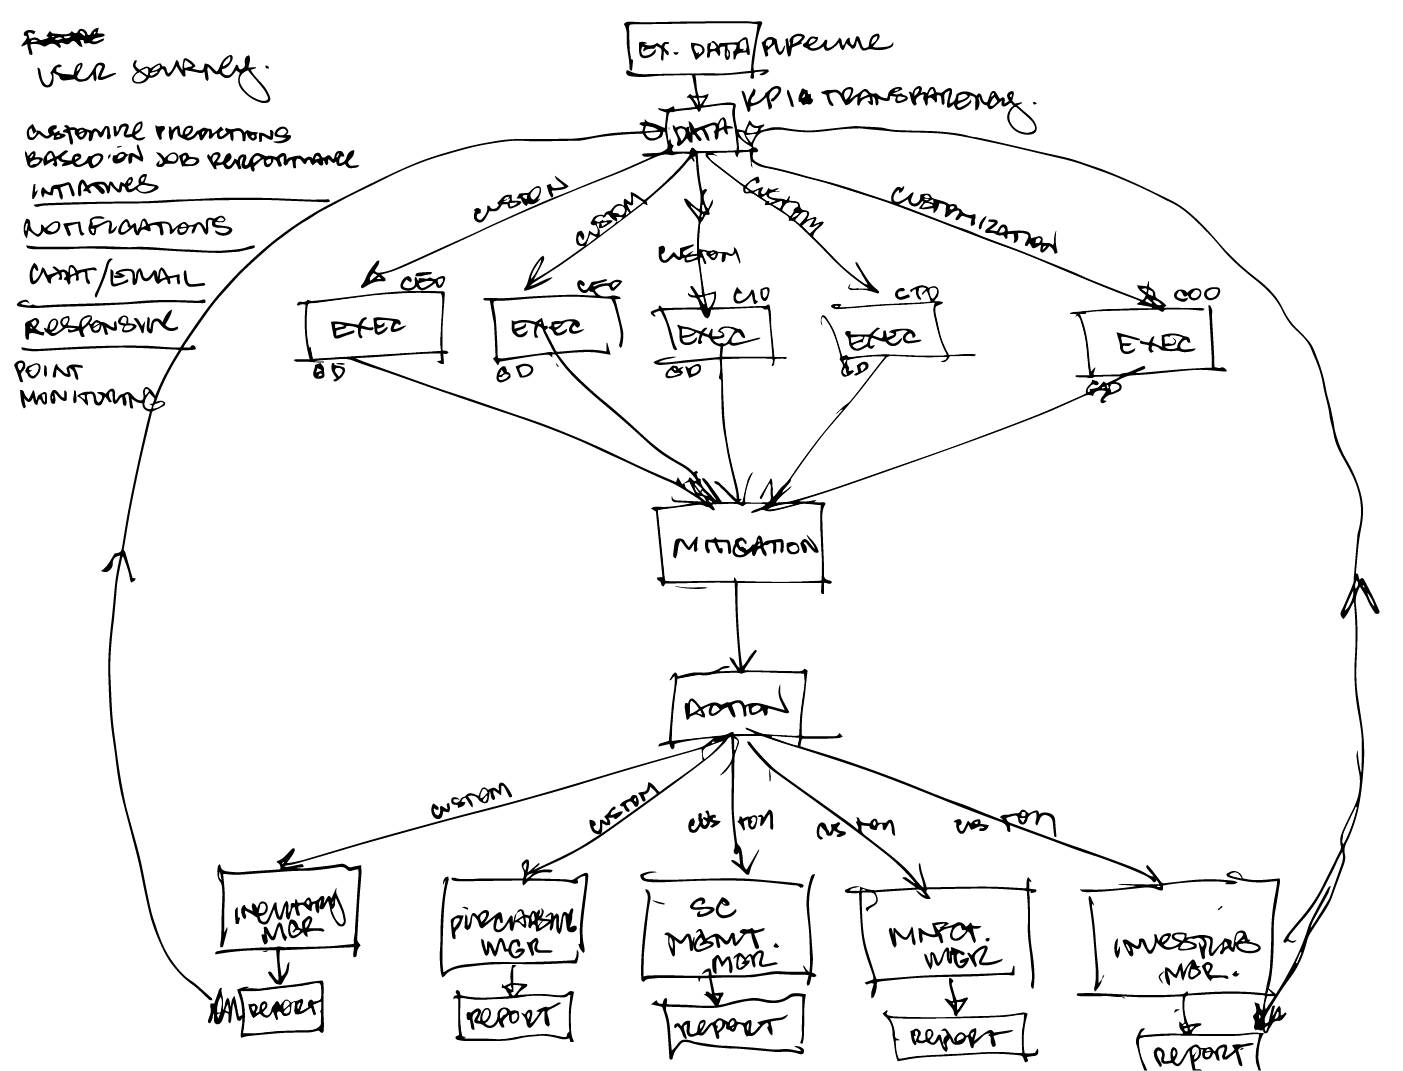
I mapped the path an analyst takes from noticing a market signal to acting on it via data ingestion through correlation, risk evaluation, and final purchase decision. This surfaced repeated re-verification of data trustworthiness at multiple steps, which drove the decision to surface data sources along their with predictive signals.
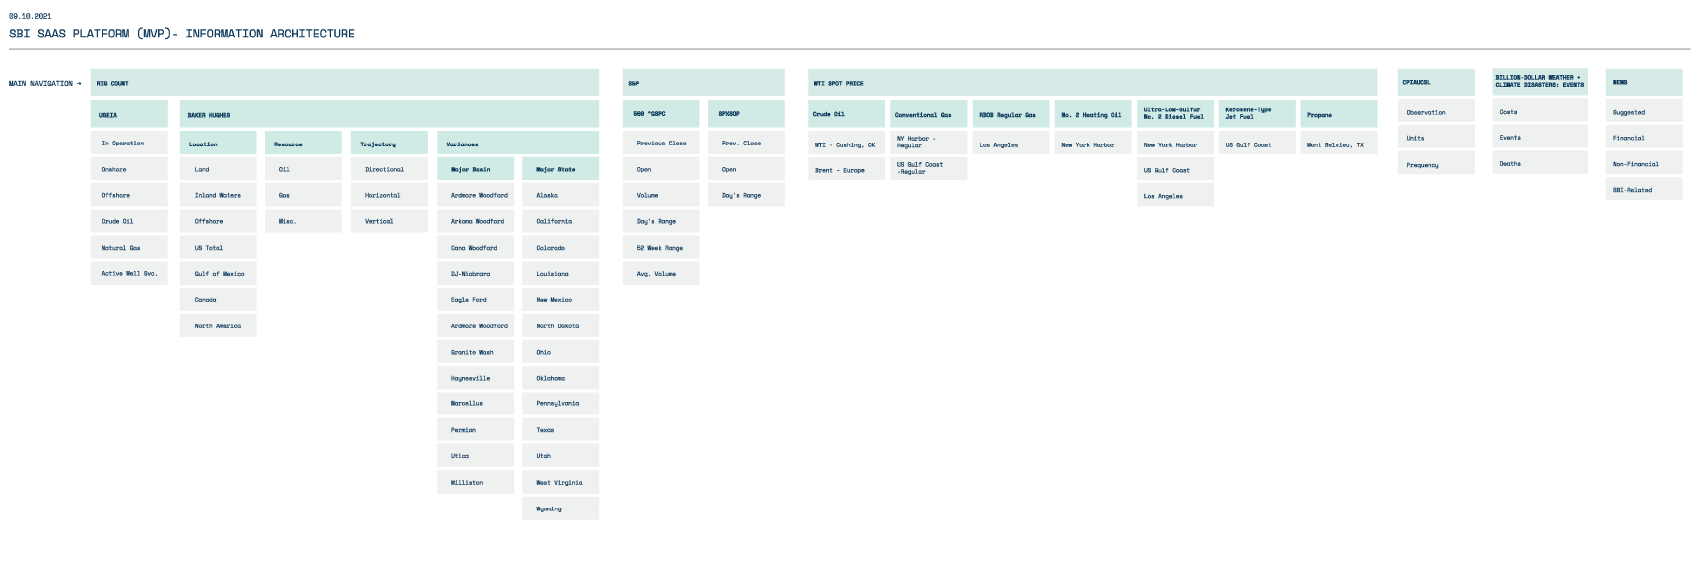
Structured around how analysts actually think about risk organized by data source and signal type rather than by feature. In this way, operational and financial data could be cross-referenced without leaving their working context.
TASK FLOW
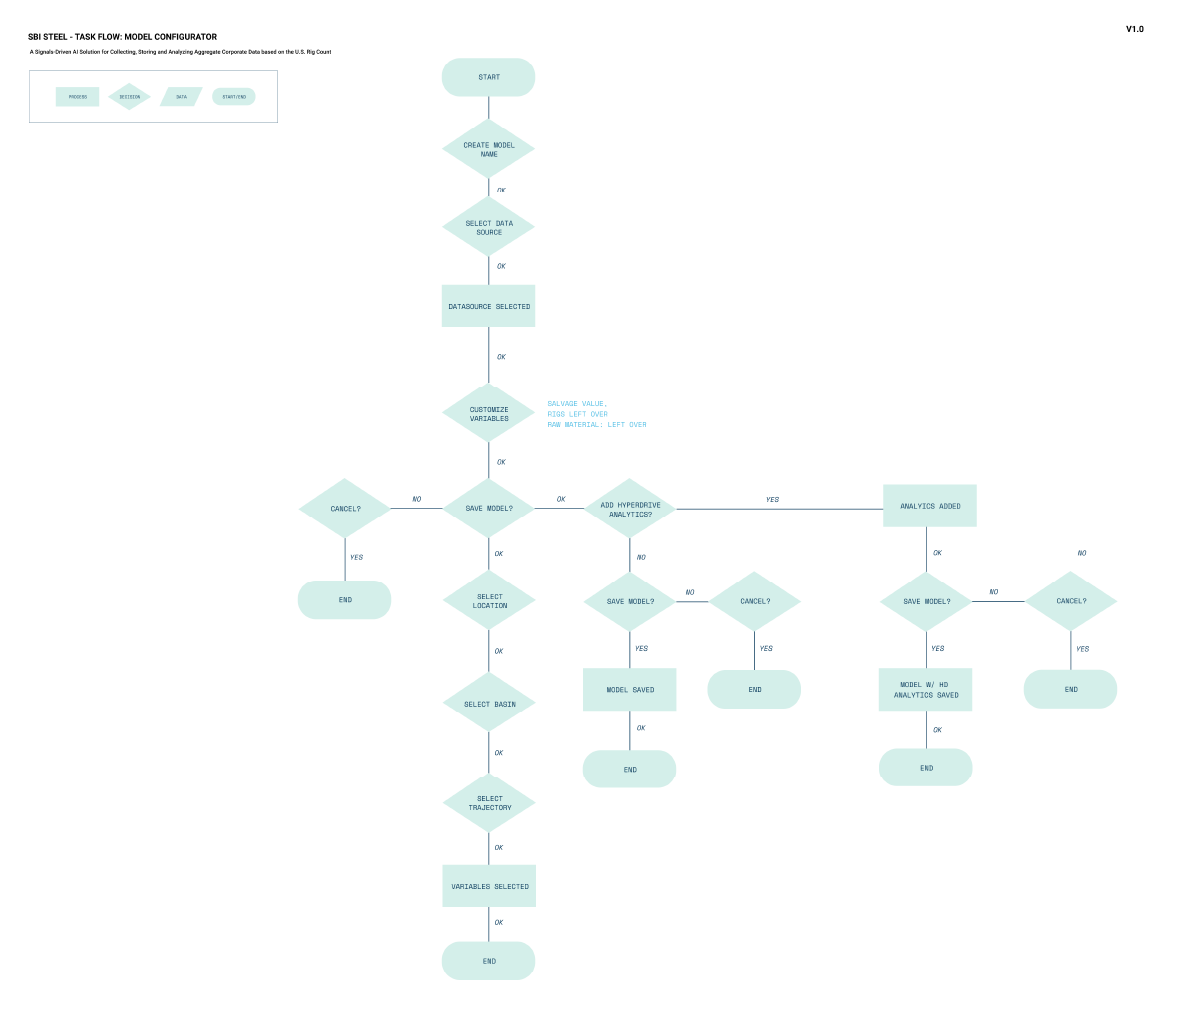
Traces how a prediction is configured and run by selecting a data source, setting parameters, and reviewing output confidence. It is designed to keep "why" visible at every step, not just the final output.
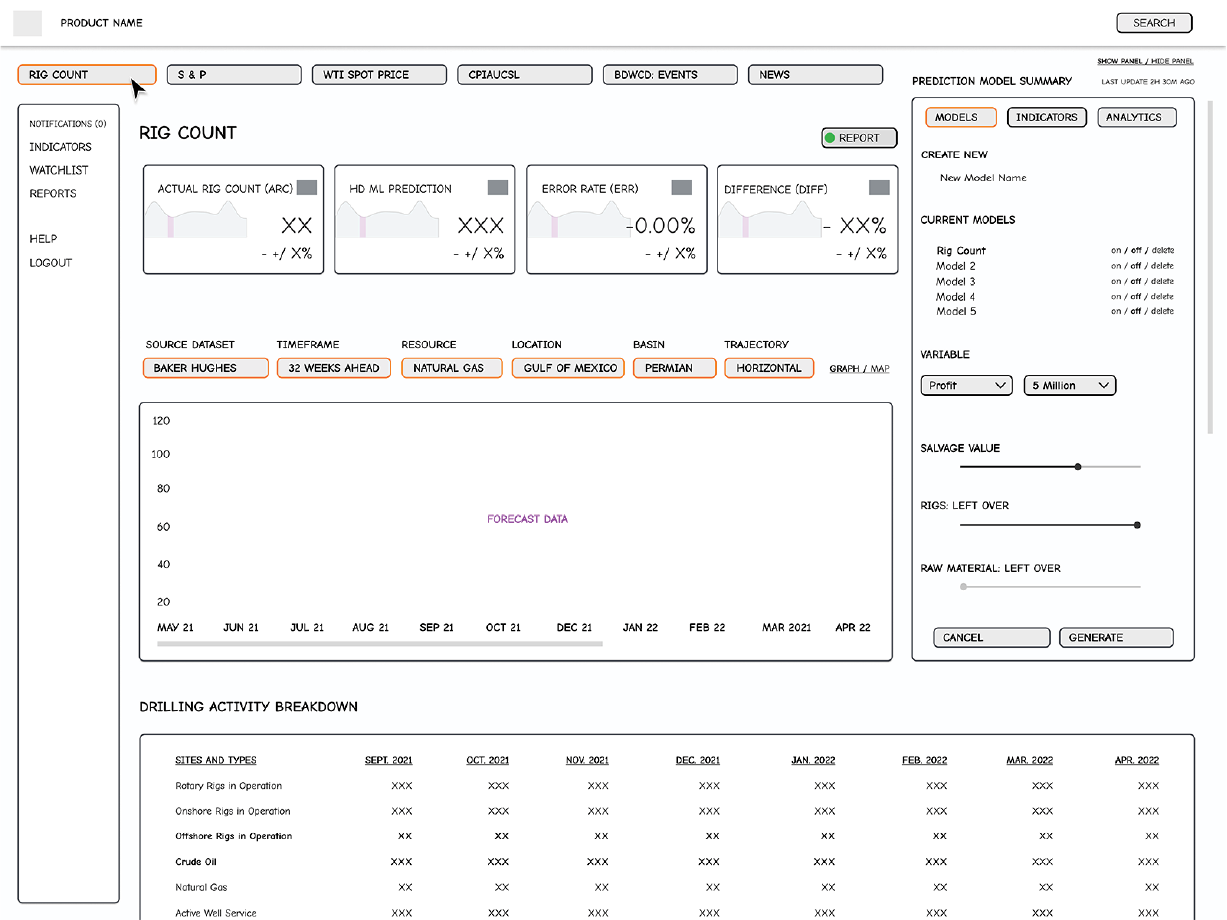
Early exploration of integrating Baker Hughes rig count data into the signal correlation view, testing how one source's trends could sit alongside other market indicators without overwhelming the primary dashboard.
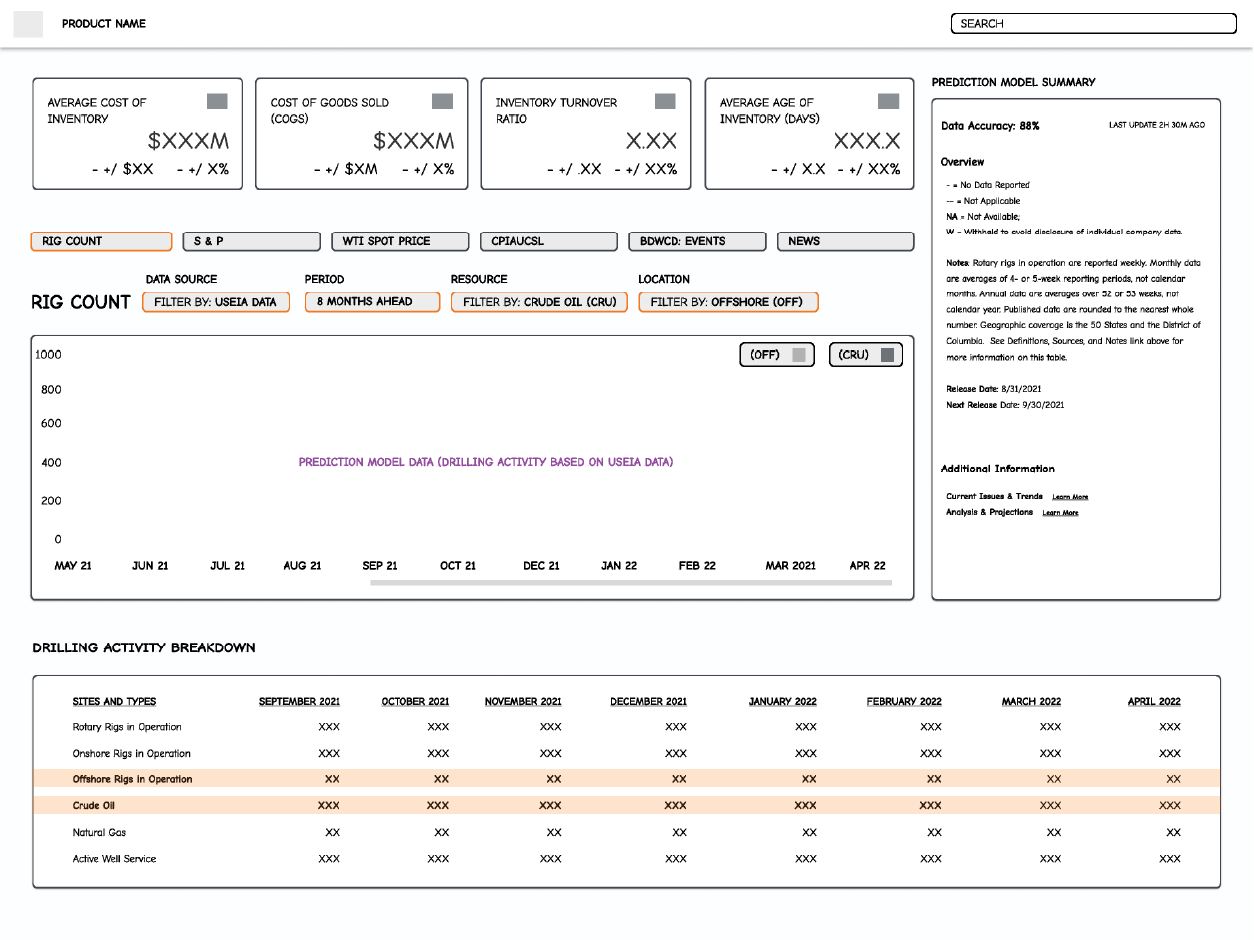
Companion exploration for the USEIA data source, testing whether a consistent visual template across sources helped analysts compare signals, or whether each source needed distinct treatment based on its own data structure.
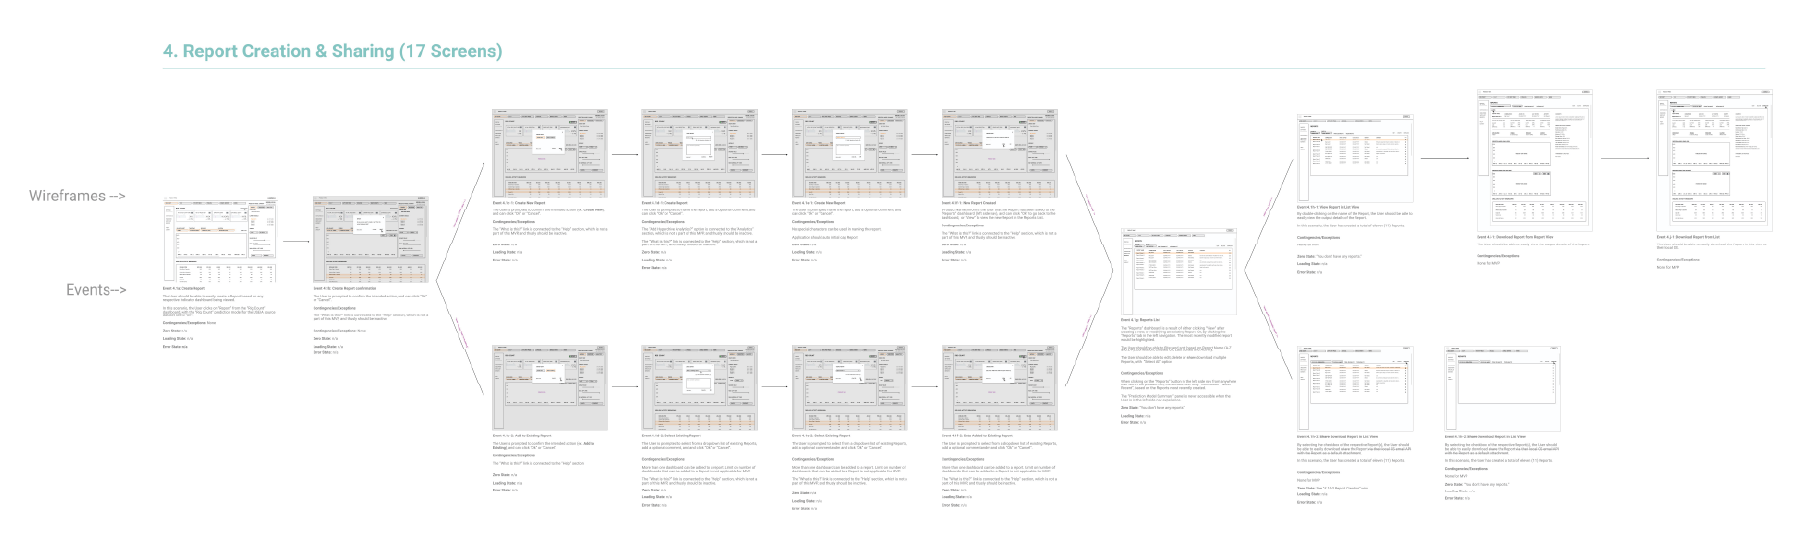
Patterns focused on letting analysts drill from a high-level signal into supporting data without losing place in the broader dashboard — expandable panels and contextual overlays instead of full page navigations, to keep analysts oriented during fast research sessions.
QUALITATIVE IMPACT & OUTCOMES
SBI Watchtower improved forecasting visibility, streamlined predictive intelligence workflows, and simplified enterprise operational analytics across distributed environments.

Showing where a signal's data came from next to the signal itself meant users no longer had to stop and double-check the data source at every step.

Testing determined whether Baker Hughes and USEIA data needed shared or distinct treatment, rather than assuming one template fit all sources.

Organizing by data source and signal type let users cross-reference financial and operational data without leaving their working context.

Streamlined report generation and sharing reduced friction between raw model output and executive time-sensitive decision-making.