We can build it and make things better.
I'm open to new projects and other opportunities.
Let's Connect →

STRUCTURED DATA MODELING
SageMaker Canvas is an Amazon Web Service that creates machine learning data models for use in predictive analytics.
SageMaker Canvas was designed to make machine learning workflows more accessible to business users through a no-code predictive analytics platform. The experience simplified complex AI and data modeling processes into intuitive workflows that supported operational forecasting, experimentation, and decision-making without requiring deep technical expertise.
Machine learning tools often require technical knowledge, fragmented workflows, and engineering dependencies that create barriers for non-technical users. Business stakeholders lacked intuitive systems for generating predictive insights, experimenting with models, and interpreting operational data efficiently.
Useful for both technical and non-technical professionals, SageMaker Canvas enables customers to automate the machine learning process without code. Via automated processes, the user can import data sources and activate workflows to run predictions on ML models.
Interaction Designer, Amazon
12 Weeks
Design Director, Visual Designer
Technical Project Manager, Field Engineer Manager
Figma, Confluence, Jira, Slack
Interviewed stakeholders and found the core barrier to ML adoption wasn't the modeling itself. It was dependency on engineering teams for every step of the workflow.
Established that the platform needed to expose enough ML complexity for accurate models without requiring ML expertise. Early prototypes left users unsure what to do.
Designed the no-code join and dataset preview flow so users could verify data compatibility without needing to understand the underlying schema.
Validated goal-first versus data-first onboarding through testing, finding goal-first reduced abandonment. Users could see relevance before committing to a data upload.
Contributed to delivering a no-code machine learning platform prototype designed to make predictive modeling accessible without sacrificing model accuracy.
SYSTEM OVERVIEW
A centralized analytics workspace designed to help business users generate predictive insights, explore forecasting scenarios, and interact with machine learning systems without technical complexity.
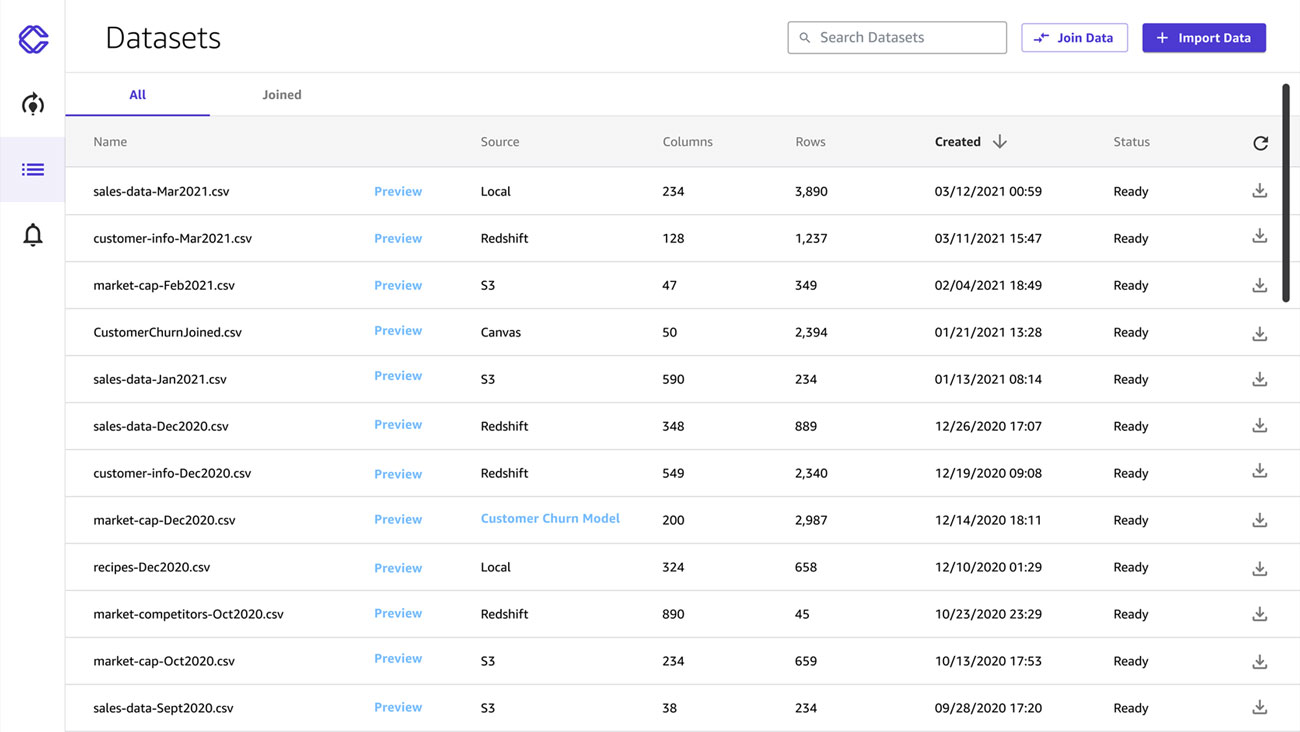

A card sorting exercise with stakeholders helped determine how data sources, model types, and workflow steps should be grouped and labeled, ensuring the platform's structure matched how non-technical users actually think about their data, not how engineers organize it internally.
The user begins by selecting "Join Data" to combine multiple data sources into a single model input, which is the first step in moving from raw, disconnected data to a structured dataset ready for prediction.
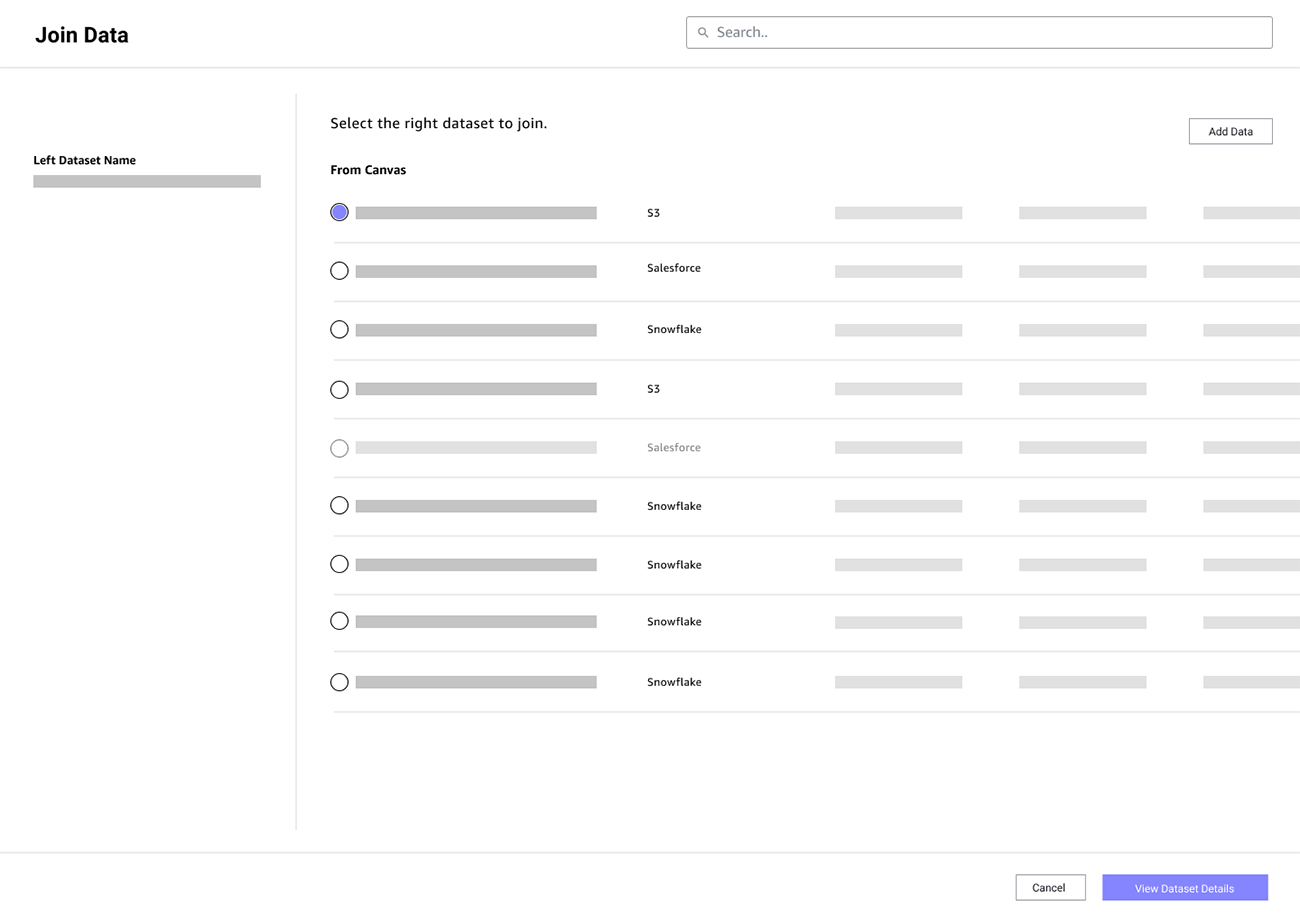
Once in the join flow, the user selects which dataset to merge in. Clear labeling and preview details at this stage were critical, since a wrong selection here would silently propagate errors through the entire model downstream.

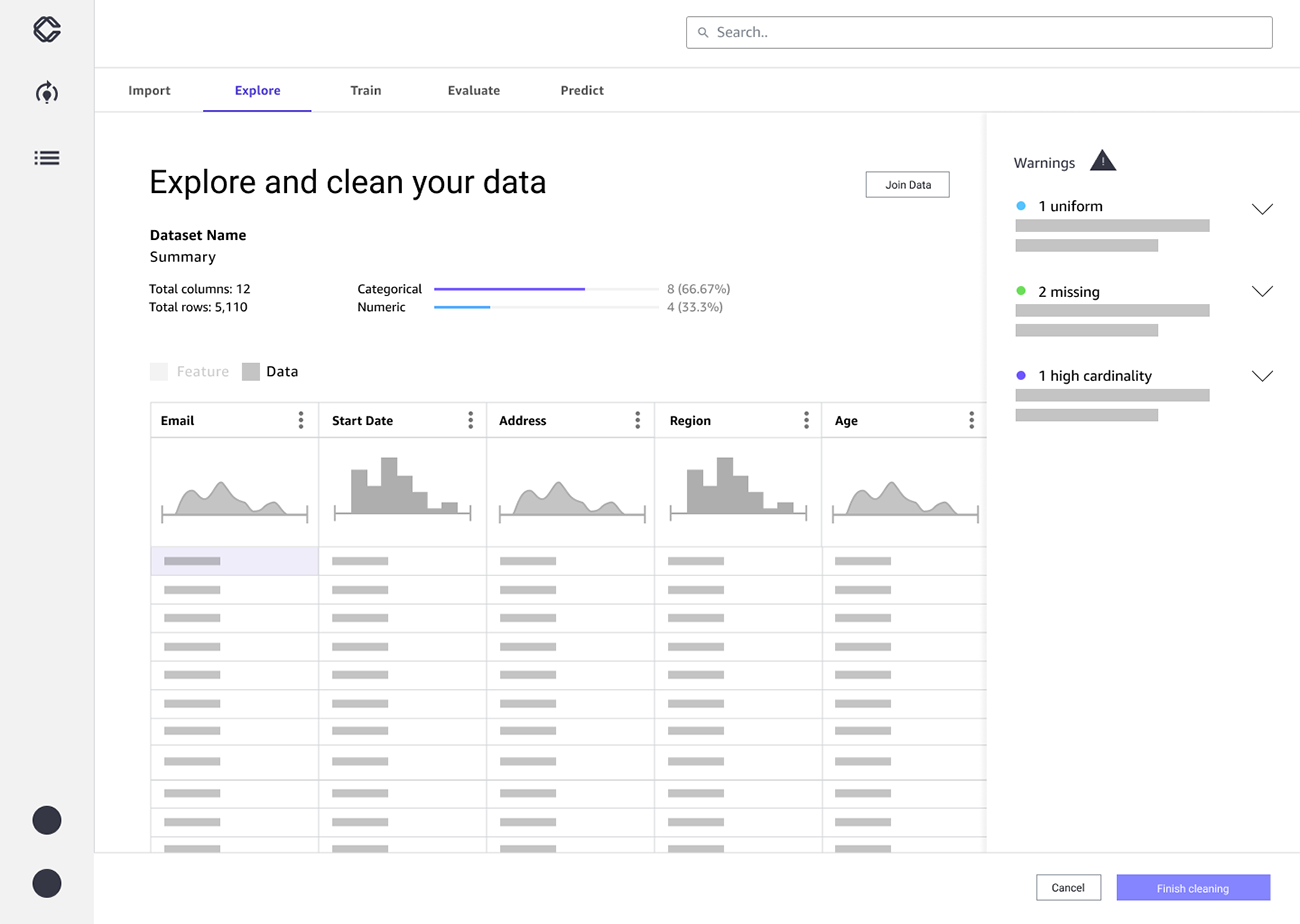
Before committing to a data join, the user can preview the selected dataset in detail (i.e. column names, data types, and sample rows) so they can verify compatibility without needing to understand the underlying schema.

A continued view of the dataset preview, refined based on usability testing to surface the specific fields most relevant to non-technical users deciding whether a dataset was the right fit.
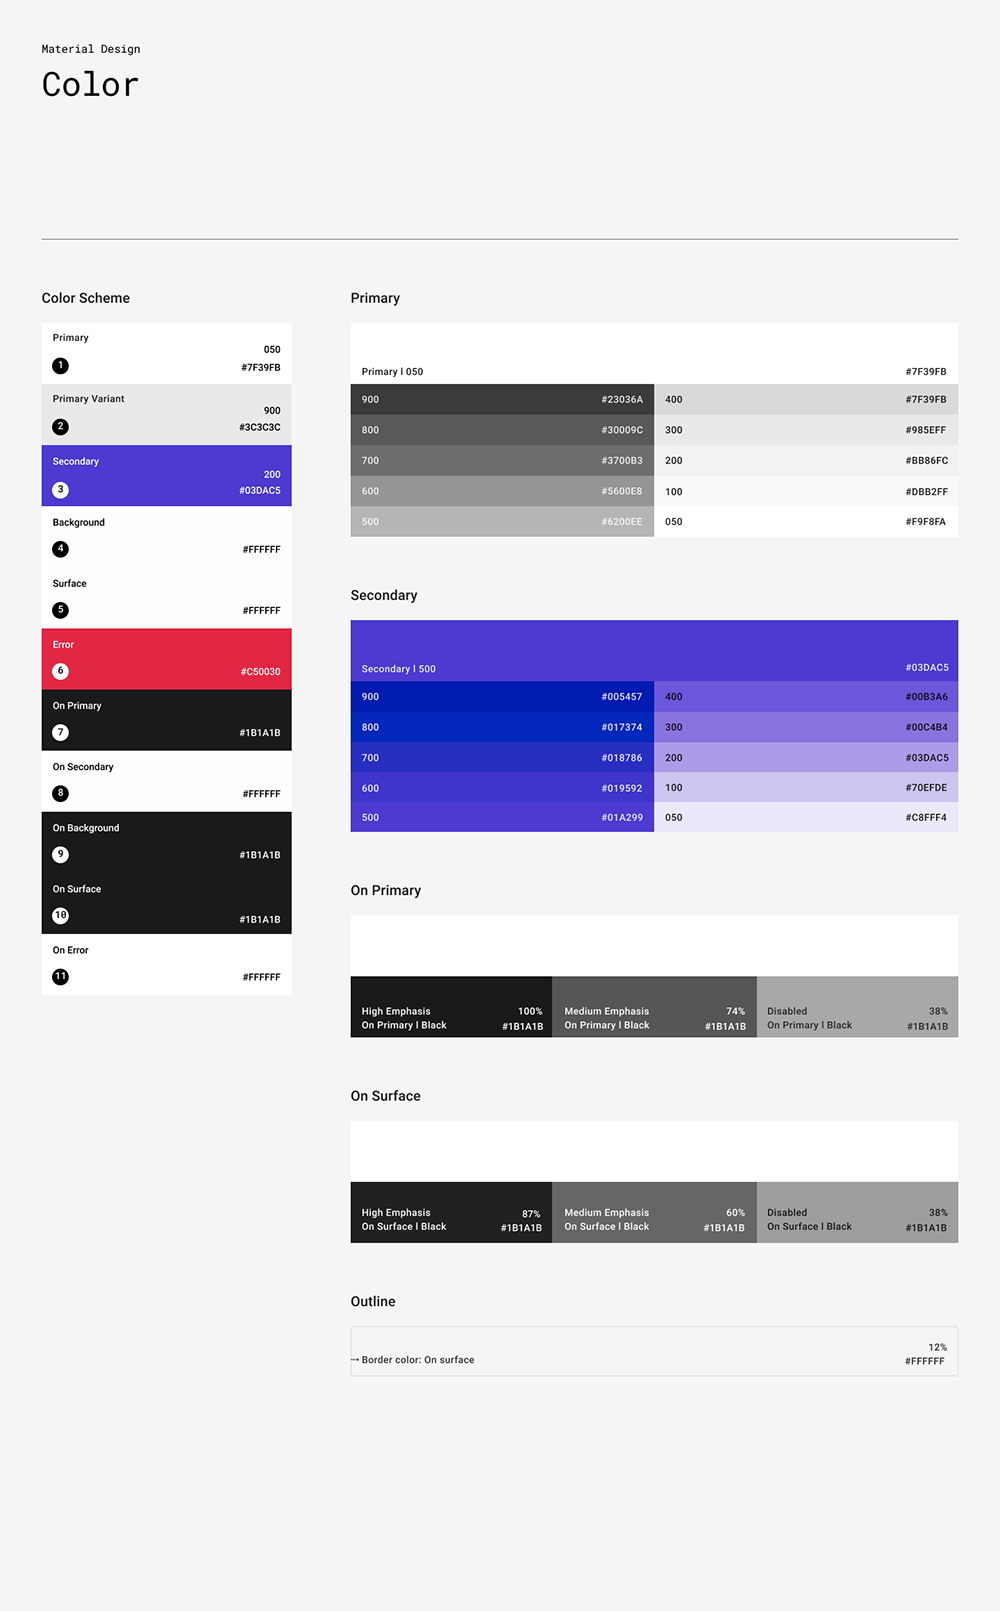
The color system was built to carry functional meaning, not just brand identity to distinguish data states, model confidence levels, and system feedback (success, warning, error) at a glance, critical for users making decisions without deep ML expertise to fall back on.
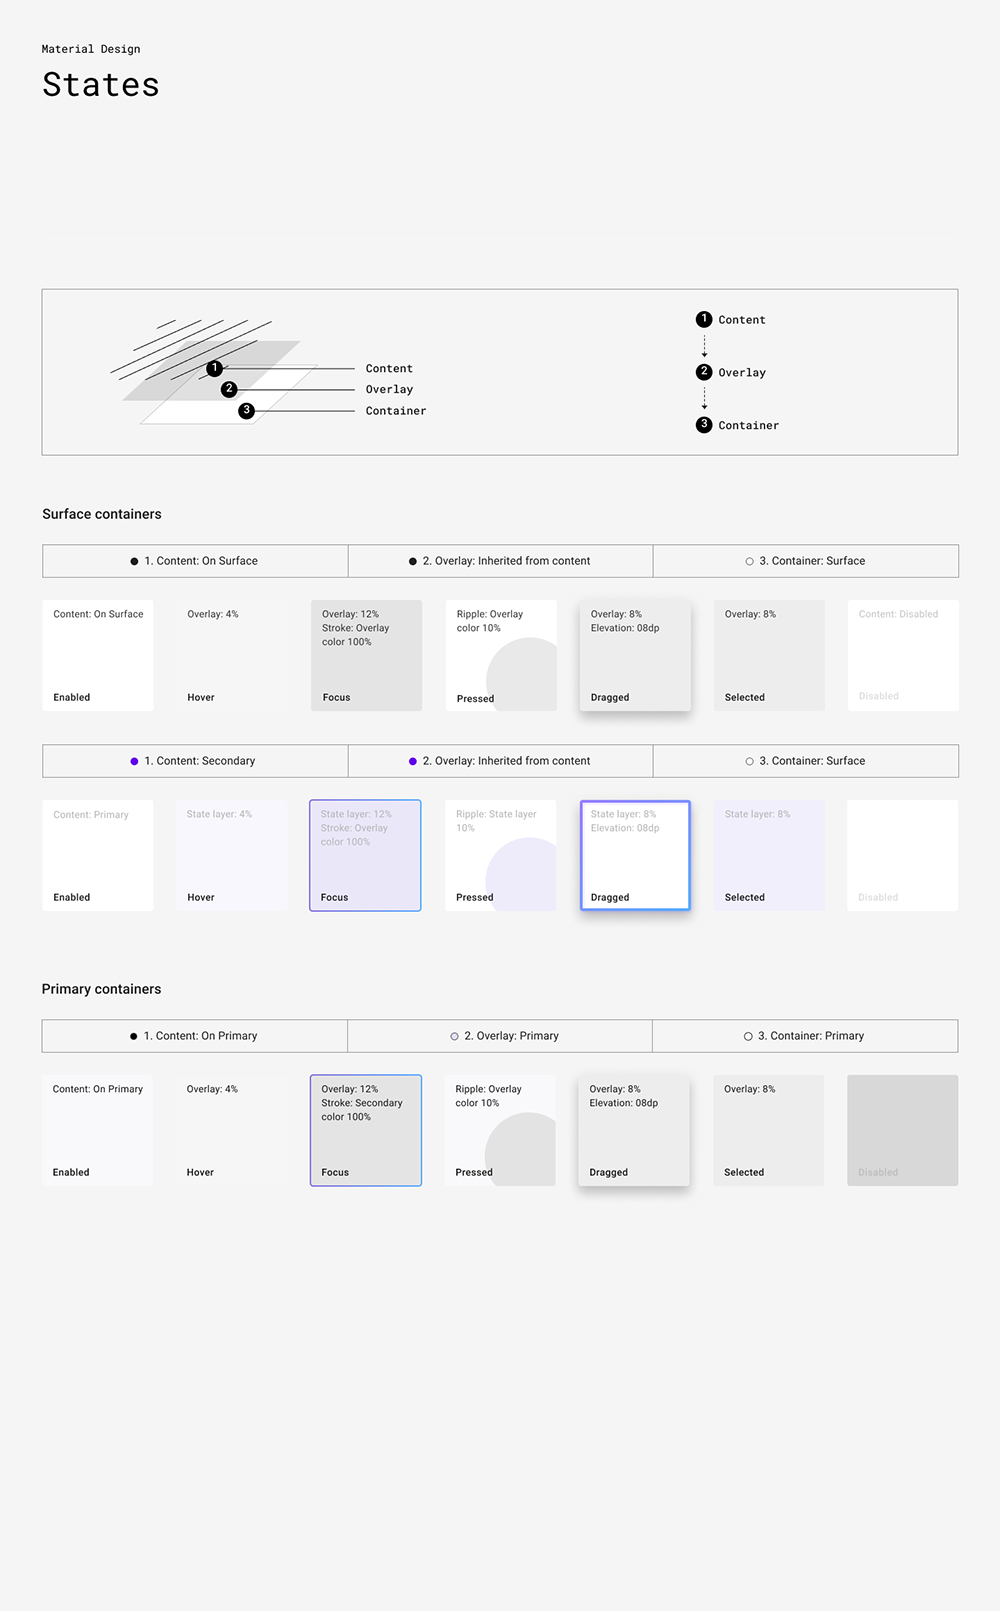
Interactive states (default, hover, active, disabled, error) were documented for every core component to ensure the no-code experience felt responsive and predictable, especially at moments like model training where users needed clear feedback that the system was working, not stalled.
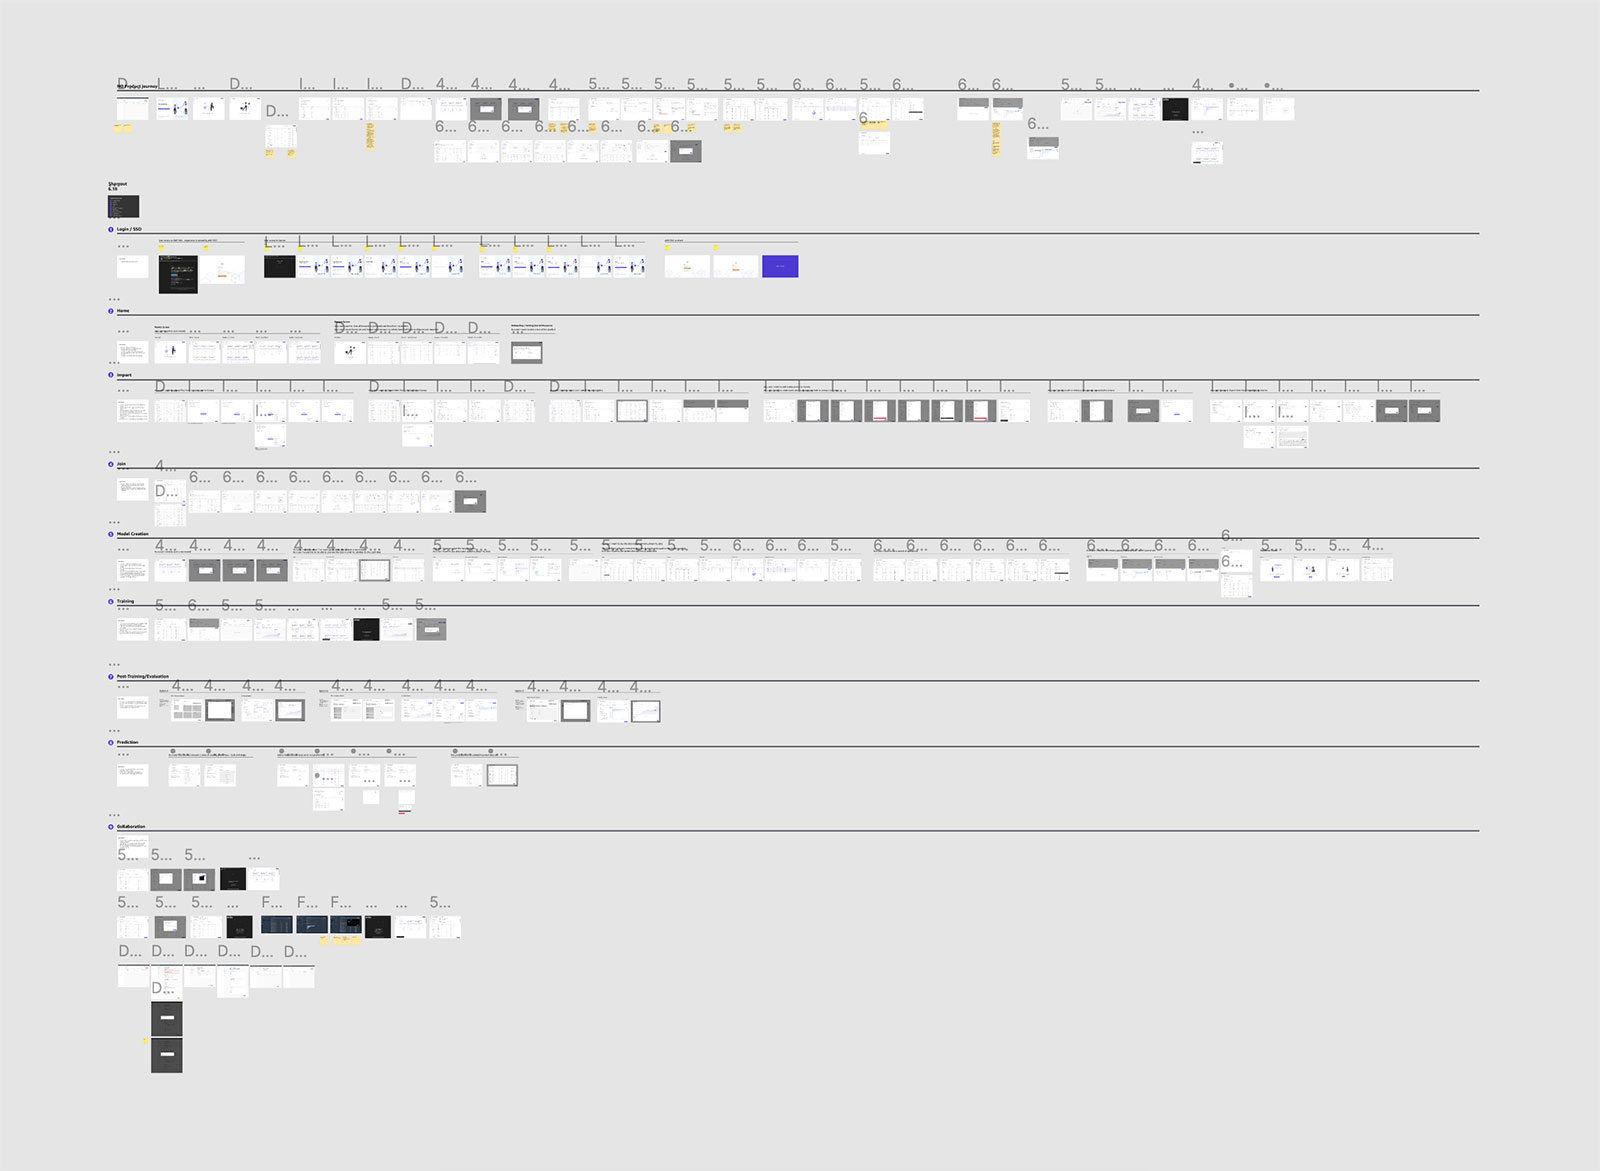
A component sandbox let the team test how join, preview, and modeling components behaved together in realistic sequences before final implementation, catching interaction issues early rather than after handoff to engineering.
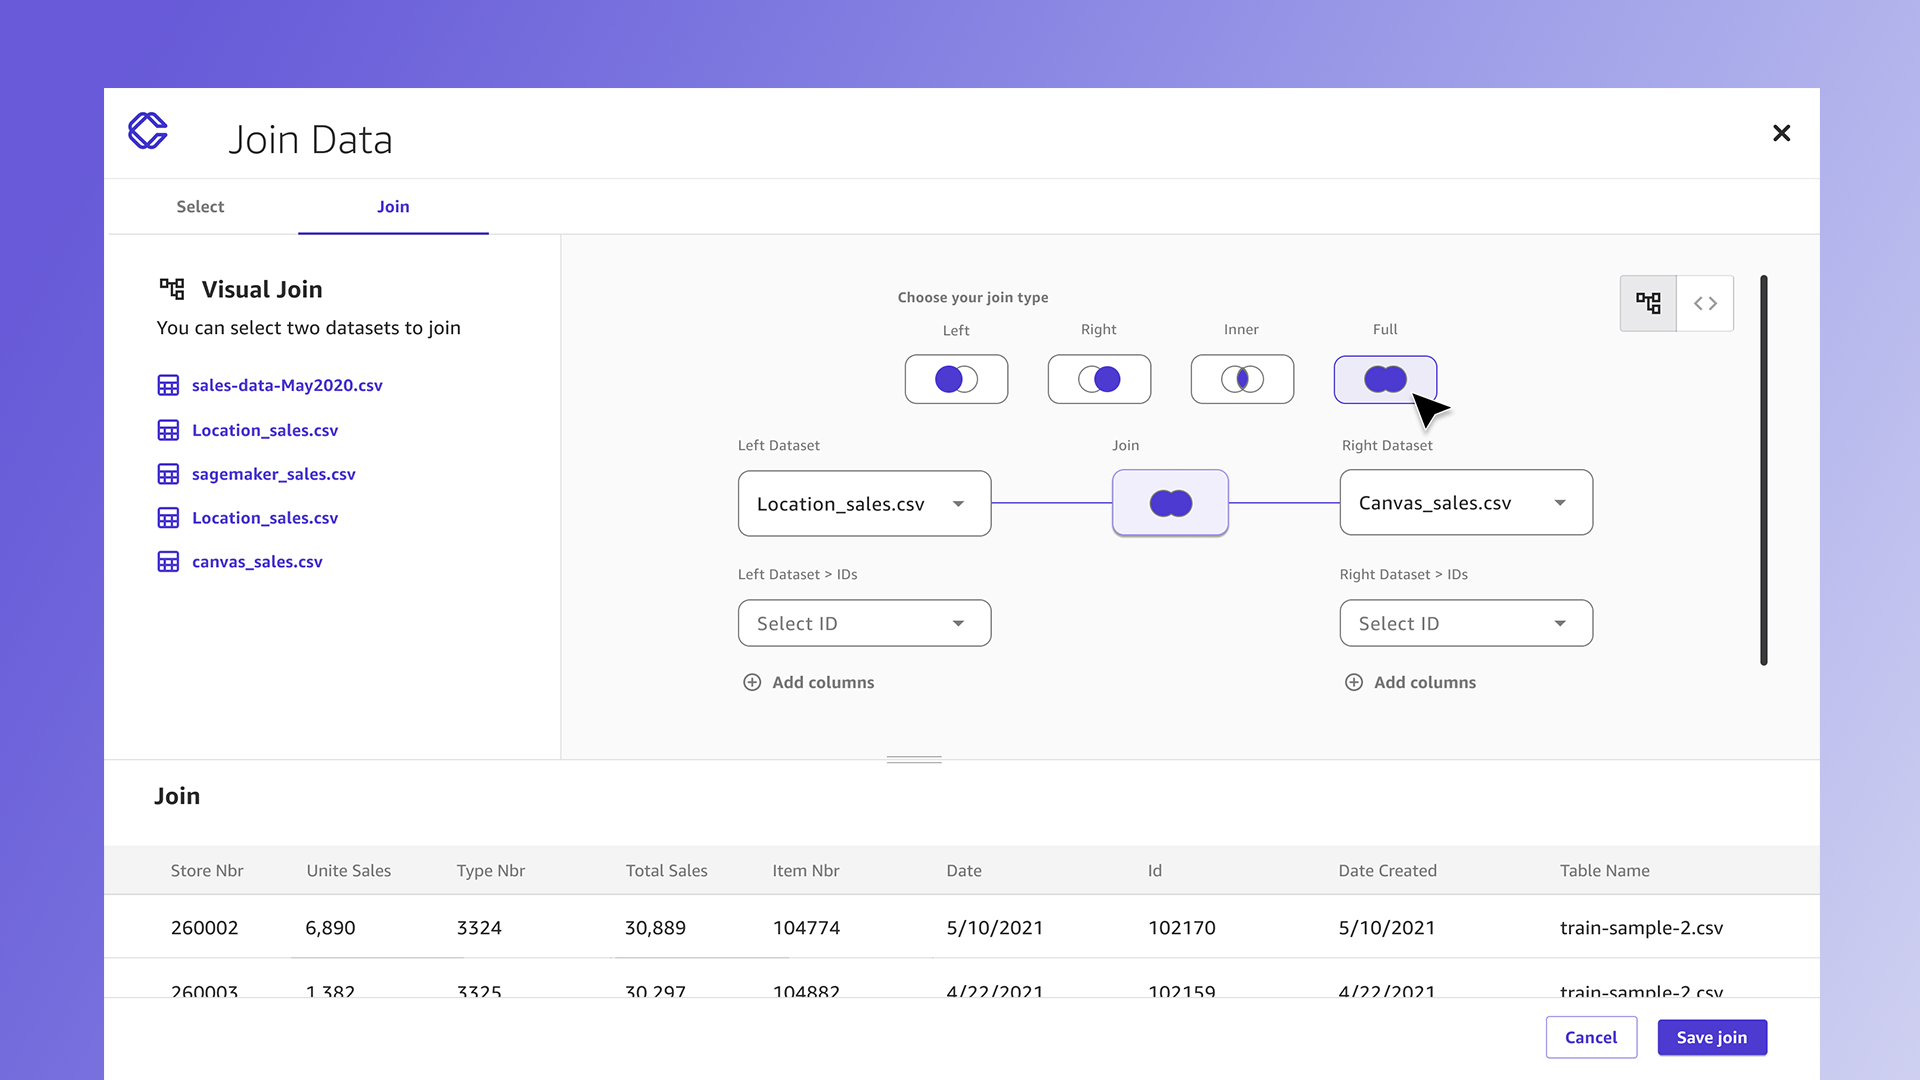
A high-fidelity view of the SageMaker Canvas experience, showing how the no-code workflow, from data import to prediction, comes together as a single, guided interface rather than a series of disconnected technical steps.

The completed join experience reflecting the final interaction pattern refined through the wireframe and sandbox testing shown earlier in this case study.

The completed join experience, showing the confirmation state once a user successfully merges their selected data sources into a working model input.
QUALITIATIVE IMPACT & OUTCOMES
SageMaker Canvas made predictive modeling accessible to business users who previously depended on data science teams for every prediction request, reducing time-to-insight and expanding who could act on data.

Cut the path from raw data to prediction from a multi-day cross-team request into a single guided, self-serve session.

Enabled non-technical business users to build and run predictive models without engineering support.

Freed data science teams from routine prediction requests, letting them focus on higher-complexity modeling work.

Presets and guardrails helped non-expert users avoid configuration mistakes that would otherwise undermine model accuracy.